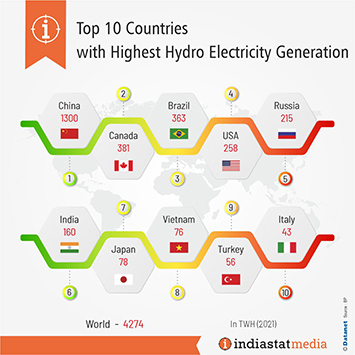
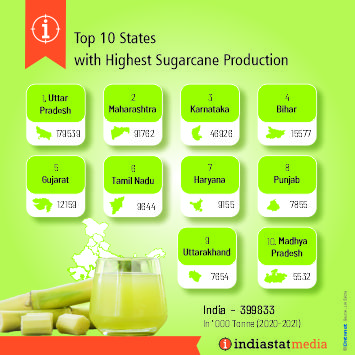
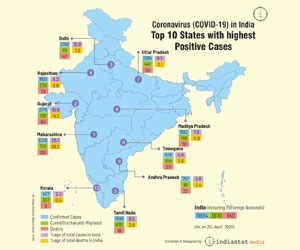
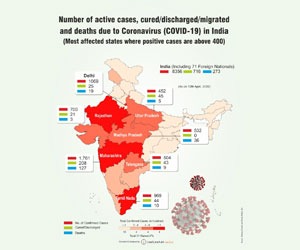
Specimen Data Tables

Specimen Data Tables : Demographics


Statewise Population in India
(Census 2001)

State

Total Male % Female %
 INDIA   1027015247   531277078   51.7   495738169   48.3 
 Jammu & Kashmir   10069917   5300574   52.6   4769343   47.4 
 Himachal Pradesh   6077248   3085256   50.8   2991992   49.2 
 Punjab   24289296   12963362   53.4   11325934   46.6 
 Chandigarh   900914   508224   56.4   392690   43.6 
 Uttaranchal   8479562   4316401   50.9   4163161   49.1 
 Haryana   21082989   11327658   53.7   9755331   46.3 
 Delhi   13782976   7570890   54.9   6212086   45.1 
 Rajasthan   56473122   29381657   52   27091465   48 
 Uttar Pradesh   166052859   87466301   52.7   78586558   47.3 
 Bihar   82878796   43153964   52.1   39724832   47.9 
 Sikkim   540493   288217   53.3   252276   46.7 
 Arunachal Pradesh   1091117   573951   52.6   517166   47.4 
 Nagaland   1988636   1041686   52.4   946950   47.6 
 Manipur   2388634   1207338   50.5   1181296   49.5 
 Mizoram   891058   459783   51.6   431275   48.4 
 Tripura   3191168   1636138   51.3   1555030   48.7 
 Meghalaya   2306069   1167840   50.6   1138229   49.4 
 Assam   26638407   13787799   51.8   12850608   48.2 
 West Bengal   80221171   41487694   51.7   38733477   48.3 
 Jharkhand   26909428   13861277   51.5   13048151   48.5 
 Orissa   36706920   18612340   50.7   18094580   49.3 
 Chhatisgarh   20795956   10452426   50.3   10343530   49.7 
 Madhya Pradesh   60385118   31456873   52.1   28928245   47.9 
 Gujarat   50596992   26344053   52.1   24252939   47.9 
 Daman & Diu   158059   92478   58.5   65581   41.5 
 Dadra & Nagar Haveli   220451   121731   55.2   98720   44.8 
 Maharashtra   96752247   50334270   52   46417977   48 
 Andhra Pradesh   75727541   38286811   50.6   37440730   49.4 
 Karnataka   52733958   26856343   50.9   25877615   49.1 
 Goa   1343998   685617   51   658381   49 
 Lakshadweep   60595   31118   51.4   29477   48.6 
 Kerala   31838619   15468664   48.6   16369955   51.4 
 Tamil Nadu   62110839   31268654   50.3   30842185   49.7 
 Pondicherry   973829   486705   50   487124   50 
 Andaman & Nicobar Islands   356265   192985   54.2   163280   45.8 

Percent Distribution of Estimated Population by
Age-Group, Sex and Residence in India
(1999)

Age-Group

Total

Rural

Urban

Total

Male

Female

Total

Male

Female

Total

Male

Female

0-4

11.6

11.8

11.5

12.2

12.4

12.0

10.0

10.1

9.9

5-9

11.2

11.3

11.1

11.7

11.8

11.6

9.9

9.9

9.8

10-14

12.0

12.2

11.8

12.3

12.5

12.0

11.0

11.1

10.9

15-19

10.3

10.6

9.9

10.2

10.6

9.8

10.3

10.4

10.2

20-24

9.2

9.1

9.3

8.8

8.8

8.9

10.1

9.9

10.4

25-29

8.1

8.0

8.2

7.9

7.7

8.0

8.9

8.9

8.9

30-34

7.5

7.3

7.8

7.3

7.0

7.6

8.2

8.1

8.2

35-39

6.3

6.3

6.4

6.1

6.1

6.2

6.9

6.9

6.9

40-44

5.7

5.7

5.7

5.5

5.5

5.5

6.3

6.3

6.3

45-49

4.4

4.5

4.3

4.2

4.3

4.2

4.9

5.2

4.6

50-54

3.8

3.8

3.8

3.7

3.7

3.8

4.0

4.1

3.9

55-59

2.9

2.9

2.9

2.8

2.8

2.9

2.9

3.0

2.8

60-64

2.5

2.4

2.7

2.6

2.4

2.7

2.3

2.2

2.4

65-69

2.0

1.9

2.1

2.0

1.9

2.1

1.8

1.7

1.9

70-74

1.3

1.2

1.4

1.3

1.2

1.4

1.2

1.1

1.3

75-79

0.7

0.7

0.8

0.7

0.7

0.8

0.7

0.6

0.7

80-84

0.3

0.3

0.4

0.3

0.3

0.4

0.3

0.3

0.3

85+

0.2

0.2

0.2

0.2

0.2

0.2

0.2

0.2

0.2

Total

100.0

100.0

100.0

100.0

100.0

100.0

100.0

100.0

100.0

Growth of Indian Population by Sex
(1901-11 to 1991-2001)

Year

Average Annual Exponential
Growth rate Percent

Female

Male

Total

1901-1911

0.53

0.61

0.56

1911-1921

-0.08

0.01

-0.03

1921-1931

1.01

1.06

1.04

1931-1941

1.30

1.36

1.33

1941-1951

1.27

1.25

1.25

1951-1961

1.93

1.99

1.96

1961-1971

2.15

2.27

2.22

1971-1981*

2.23

2.18

2.20

1981-1991**

2.10

2.17

2.14

1991-2001

1.97

1.90

1.94

Close